
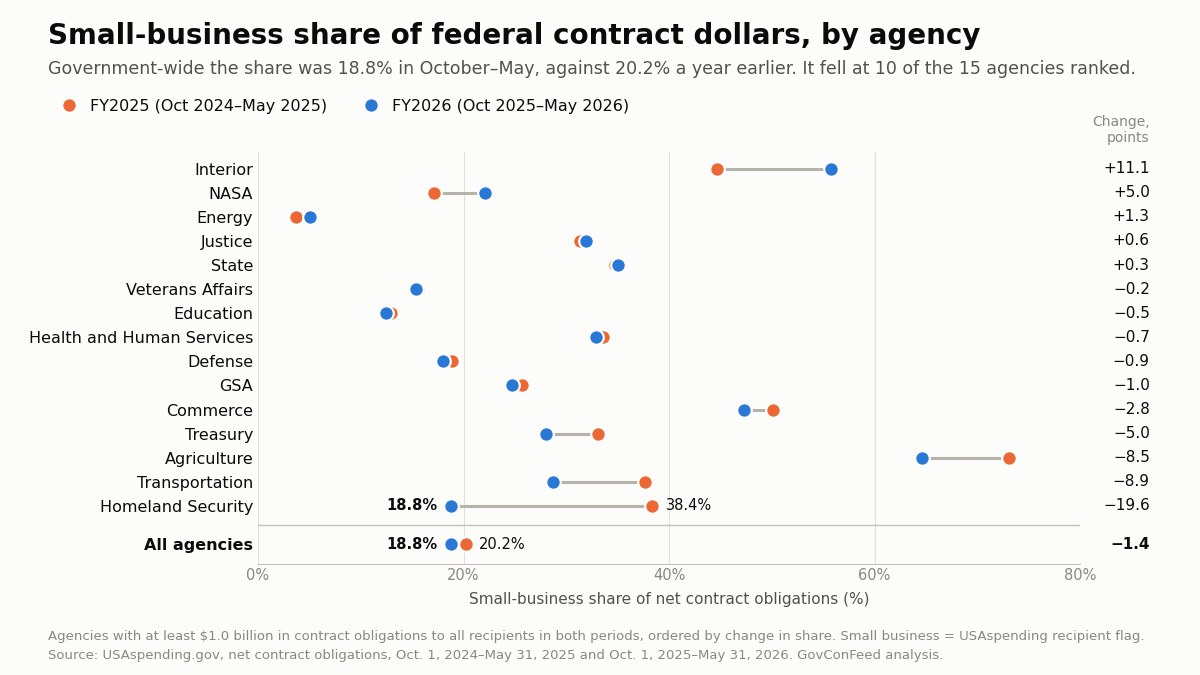
Recipients flagged as small businesses received $98.0 billion in federal contract obligations in the first eight months of fiscal 2026, according to a GovConFeed analysis of transaction records published on USAspending.gov. That is 18.8% of the $520.9 billion agencies obligated to all recipients. From October 2024 through May 2025 the figures were $86.1 billion of $425.1 billion, or 20.2%. The share is 1.4 percentage points lower.
Both amounts rose. Obligations to flagged small businesses were up 13.8%, or $11.9 billion. Obligations to every other recipient were up 24.7%, from $339.1 billion to $423.0 billion. The measure is USAspending's small-business recipient flag, applied to net obligations inside each window. It is not the Small Business Administration's annual procurement scorecard.
The share fell at ten of the 15 agencies ranked
GovConFeed ranked the 15 of 68 agencies in the records with at least $1.0 billion in contract obligations to all recipients in both periods. They hold 99.0% of all-recipient obligations this year and 98.7% a year earlier. The small-business share rose at five of them and fell at ten.
| Agency | Small business, FY2025 | Small business, FY2026 | Share, FY2025 | Share, FY2026 | Change, points |
|---|---|---|---|---|---|
| Interior | $1.4B | $1.7B | 44.7% | 55.8% | +11.1 |
| NASA | $1.4B | $1.7B | 17.1% | 22.1% | +5.0 |
| Energy | $1.3B | $2.1B | 3.7% | 5.0% | +1.3 |
| Justice | $1.5B | $1.8B | 31.3% | 31.9% | +0.6 |
| State | $1.6B | $1.3B | 34.8% | 35.0% | +0.3 |
| Veterans Affairs | $6.0B | $6.8B | 15.6% | 15.4% | -0.2 |
| Education | $0.2B | $0.2B | 12.9% | 12.4% | -0.5 |
| Health and Human Services | $3.0B | $3.4B | 33.5% | 32.9% | -0.7 |
| Defense | $51.7B | $58.0B | 18.9% | 18.0% | -0.9 |
| GSA | $3.4B | $3.7B | 25.7% | 24.7% | -1.0 |
| Commerce | $0.9B | $1.1B | 50.1% | 47.3% | -2.8 |
| Treasury | $1.9B | $1.0B | 33.1% | 28.1% | -5.0 |
| Agriculture | $3.5B | $3.3B | 73.1% | 64.6% | -8.5 |
| Transportation | $1.6B | $2.1B | 37.6% | 28.7% | -8.9 |
| Homeland Security | $4.5B | $7.7B | 38.4% | 18.8% | -19.6 |
| All agencies | $86.1B | $98.0B | 20.2% | 18.8% | -1.4 |
Two agencies, Labor and the Agency for International Development, cleared the threshold in only one period and are not ranked.
Homeland Security's obligations were 3.5 times the year-earlier level, and its small-business share fell 19.6 points
The Department of Homeland Security obligated $41.1 billion on contracts in the window, against $11.6 billion a year earlier. Its obligations to flagged small businesses rose, from $4.5 billion to $7.7 billion. Its share went from 38.4% to 18.8%, the largest decline of the 15.
Customs and Border Protection went from $1.9 billion to $25.7 billion in obligations to all recipients, and its small-business share from 25.8% to 6.9%. With CBP taken out of both periods, the rest of DHS had a small-business share of 38.6%, against 40.8% a year earlier. Of the four DHS components with at least $1.0 billion in both periods, the share fell at two, CBP and the Coast Guard, where it went from 59.3% to 20.9%. It rose at Immigration and Customs Enforcement, from 37.6% to 54.5%, and at the Office of Procurement Operations.
The largest DHS transaction in the window is a $1.7 billion order to Southwest Valley Constructors Co, dated May 11, 2026. CBP's record of it reads in full: “AWARD OF CONSTRUCTION TASK ORDER FOR BORDER WALL IN BIG BEND TEXAS, SEGMENT IDENTIFIED AS BBT-4.” Fisher Sand & Gravel Co is the largest DHS recipient in the window, at $9.5 billion, counting each registered name on its own. It is not among the 100 largest DHS recipient records that carry the small-business flag.
Taking DHS out of both periods leaves a government-wide share of 18.8%, against 19.7%: a decline of 0.9 points. Taking out the Department of Defense, which holds 62% of all obligations this year, leaves a decline of 2.5 points, from 22.7% to 20.2%. Removing any other ranked agency gives a decline between those two.
Transportation's share fell 8.9 points and Agriculture's 8.5, while Interior's rose 11.1
At the Department of Transportation, obligations to all recipients went from $4.4 billion to $7.4 billion, and to flagged small businesses from $1.6 billion to $2.1 billion. The Federal Aviation Administration went from $3.0 billion to $5.6 billion, and its share from 31.7% to 20.9%. At Agriculture, small-business obligations went from $3.5 billion to $3.3 billion and the total from $4.7 billion to $5.1 billion.
At the Department of the Interior, which had the largest gain, the total went from $3.2 billion to $3.0 billion and small-business obligations from $1.4 billion to $1.7 billion.
Energy's small-business obligations went from $1.3 billion to $2.1 billion. One task order, $900 million to General Matter, Inc. on March 4, 2026, is the largest small-business-flagged transaction in either window. With it taken out of both the small-business figure and the total, the department has $1.2 billion and a share of 3.0%, below the year-earlier 3.7%. That would make four ranked agencies up and 11 down.
What It Means for Contractors
The Defense Department obligated $58.0 billion to flagged small businesses in the window, 59% of the government-wide amount, against 60% a year earlier.
DoD and DHS together account for 80% of the $11.9 billion rise in small-business obligations. Small-business obligations fell at three of the 15 ranked agencies: State, Treasury and Agriculture.
Atlantic Diving Supply, Inc. is the largest small-business-flagged recipient in both periods, at $3.5 billion this year and $2.8 billion a year earlier, counting each registered name on its own. Parents and differently named subsidiaries are not combined.
How we did this
GovConFeed queried the public USAspending.gov API on Sept. 19, 2026 for contract obligations (award types A, B, C and D: BPA calls, purchase orders, delivery orders and definitive contracts) with action dates from Oct. 1 to May 31 in each fiscal year. Figures are net obligations: de-obligations reduce them. Small-business figures use the API's recipient/business type filter set to small_business. The records do not say how that flag is assigned. Agency and component figures are by awarding agency.
For each window, monthly totals and agency totals were pulled separately, with and without the filter, and all four pairs agree. Net de-obligations produce negative totals, or shares below zero or above the whole, at nine unranked agencies in each period.
The window stops at May 31 because Defense contract data is published on a 90-day delay. We examined each month's 25 largest increases and 25 largest decreases, for all recipients and again for flagged small businesses. Three all-recipient awards carry an entry and a reversal that match to within 0.05% of the amount reversed, the largest $1.7 billion to Thalle Construction Co Inc. None carries the small-business flag. The small-business scan shows four further pairs under that rule, the largest $91 million. Widening the rule to 1% adds one all-recipient award and two in the small-business scan. The largest, a $256 million Treasury entry to FCN, Inc. with $254 million reversed, carries the flag and appears in both scans. Both legs of every pair fall inside a single window, and this article makes no month-by-month claim. The scans cannot see a reversal dated after May 31. Recipient figures come from the 100 largest recipient records of each query, so a company spread across small registered entities is understated. This analysis does not establish why any agency's share or spending changed.
Sources
- USAspending.gov API: spending_over_time, spending_by_category, spending_by_transaction
- USAspending API: award type codes
- USAspending API search filters: the recipient/business type filter
- SBA: small business procurement scorecard
- FPDS: availability of Department of Defense data
